Intro to Dashboard Part – III
In my last blog,
I discussed about the Solr Core Admin of Apache Solr Dashboard. Now we will discuss next tab.
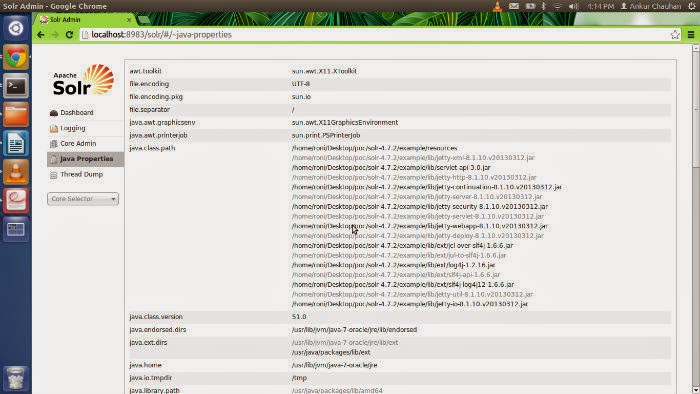
Java Properties
The Java Properties screen provides easy access to all the properties of the JVM running Solr, including the class paths, file encodings, operating system, and more.
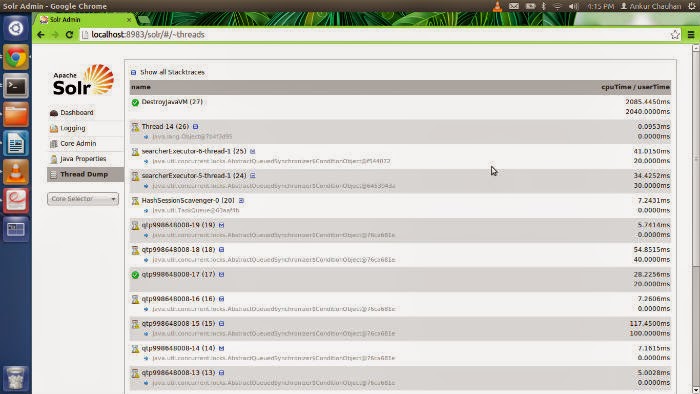
Thread Dump
The Thread Dump screen lets you inspect the currently active threads on your server. Each thread is listed and access to the stacktraces is available where applicable. Icons to the left indicate the state of the thread: for example, threads with a green check-mark in a green circle are in a “RUNNABLE” state. On the right of the thread name, a down-arrow means you can expand to see the stacktrace for that thread.
when you take mouse over any of the thread then it will show you the status of that thread i.e. It is in NEW, WAITING, TIMED_WAITING, RUNNABLE, BLOCKED , TERMINATED state.
Reference Url
https://cwiki.apache.org/confluence/display/solr/Thread+Dump
Happy Coding
Namah Shivay


Recent Comments